Power BI report on the Financials sample data
Sample report on the financials sample data provided in Power BI under "Try a sample semantic model" option
2/16/20242 min read
In a recent LinkedIn post (link) related to a report developed as part of the "Power BI Challenges : 15 skills" course, I have discussed an essential aspect of Power BI report development - Dimensional modelling. The following points are derived from my consulting experience and highlight some of the practices that are beneficial to adopt from the start.
While the below list isn't comprehensive, it focuses on the fundamental areas which significantly impact the report efficiency and its utility (particularly when working with medium to large datasets).
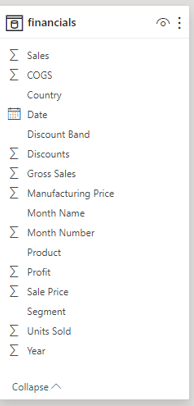
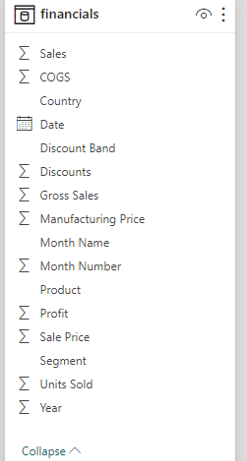
Note - Dataset used is the sample financials data provided in Power BI as shown below.
Visualization enhancements
Field parameters - currently in preview (link), this feature enables to dynamically filter the data based on the measures/ dimensions selected. For example, we can interactively slice the Treemap and Stacked column chart based on the field parameter (Net Sales, Profits, Profit %) selected.
Treemap visual as a slicer - offers a dynamic approach to visualize key metrics across multiple dimensions through the use of conditional formatting. We can quickly analyse the better/worse performing products or segments etc by looking at the color gradient.
Clear filters button - very useful to have this functionality (configured to show the default state of the report using a bookmark) in order to quickly reset the filters.
Below is a sample Sales Dashboard, I have designed covering the topics we have explored in this blog post. I hope it has provided some fresh insights to your report creation process and in improving the overall user experience.
Hope you have found the above content helpful. We would love to know your thoughts and interact with you in the comment section below.
Modelling enhancements
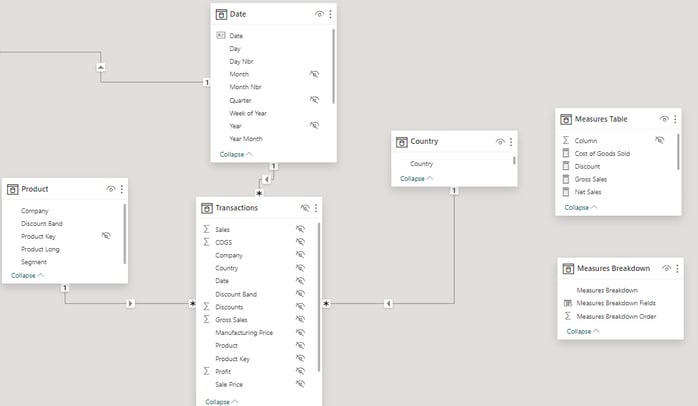
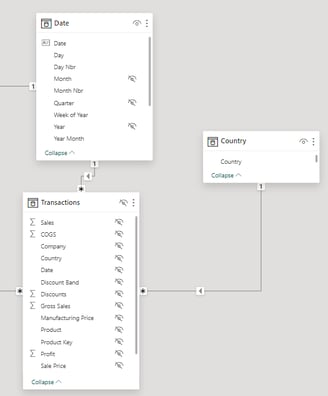
Splitting the single financials table into multiple tables through dimensional modelling - This is achieved by implementing a star schema approach (link) with the Transactions Fact table in the centre surrounded by various dimensions tables like Product, Date, Country.
Introducing a dedicated Date Dimension table which significantly aides the ability to efficiently handle Time intelligence functions.
Creation of a unique Product table with a custom key derived from the attributes (Product Long, Company, Discount Band, Segment) minimizes data duplication, thereby ensuring data integrity and reducing redundancy.
Creating a dedicated Measures table to consolidate all the measures and hide all foreign keys - making it easy for the report users to navigate the model.